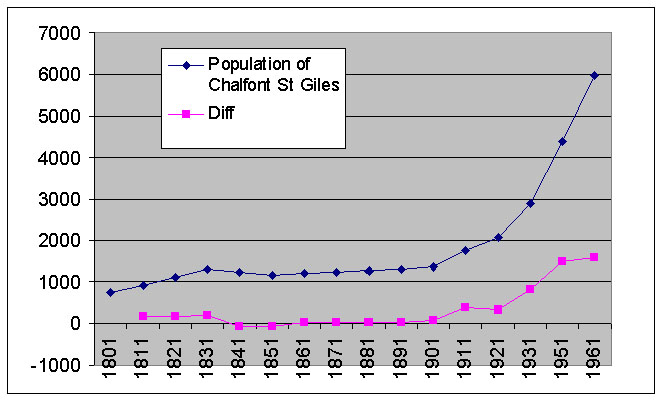
Population growth and change in Chalfont St Giles.
The pattern of the growth of Chalfont St Giles throughout the 19th century is not one of regular increase. There was a rapid rise in the early years followed by a slight decline and then a static population until the end of the century when there came an exponential growth into the 20th century.
This information is based on the data in the national census which was carried out in 1801 and then repeated every 10 years right up to the present day with the exception of that for 1941.

The first four of the census only collected summary numbers of people and number of houses or families. In 1841 individual names began to be collected with a small amount of personal data. Every year after that saw changes, usually increases, in the amount of information collected.
Throughout the 19th century the basic unit of government for which data was collected was the parish. This was then summarised into larger groupings, then by county, and finally a nationwide population figure was arrived at. We therefore have the ability to look at how the population of Chalfont St Giles changed over the period and also to compare it against other local parishes and towns and to compare the local trend with that for larger groupings.
From the beginning of the century up to 1831 the population of Chalfont St Giles increased dramatically at almost 20% every 10 years from 762 people in 1801 to 1297 people by 1831. There was rapid rate of increase across the whole country during these years primarily due to a fall in death rate brought about by improvements in medical care. However the rate of increase in Chalfont St Giles was somewhat more than the national rate. When we come to 1841 there is a significant change. The national trend continues at the same or an increasing rate right to the end of the century but this is not matched in Chalfont St Giles. 1841 actually saw a reduction in the number of people in the parish and this continued with a further reduction in 1851 followed by slight increases in the rest of the years until at the end of the century when the population was only 65 people more than it had been 70 years previously.
A similar pattern can be seen in the population history of Chalfont St Peter although it is nowhere near as marked as it was in Chalfont St Giles. Even at the county level Bucks saw a much slower growth than the national average across the whole of the century. The pattern for Amersham is interesting it initially followed the national average but continued growing until 1851 after which it saw a rapid decline for a period.
So what can we conclude from these figures. The rapid rise in population must have put a strain on a housing resources within the parish had led to people moving between parishes much more than they had done in the past. This is borne out by the much larger number of houses in 1821 when this information recorded compared to 1801 when it was also recorded. Even so there are still a significant number of houses being built. Where else can all these people live. There is evidence from the tithe records that many families occupied small tenement on what can only be considered waste or marginal land. For example The Huts along the main Amersham Road, and the houses at Kiln Yard in Three Households and The Fishery along the Misbourne.When names and places of bith began to be recorded we can see that many of these families were incomers to the parish.
It seems probable that by 1831 the population within the parish had reached the maximum it could support within the local economy and so any natural growth could only be accommodated by emigration to find work. This is of course the time of the industrial revolution and the growth in the factory workforces brought about by people moving in from the countryside. When the Reverend P. W. Phipps became rector in 1886, he commented upon the surly nature of the population and to one inward looking they were. This could easily have been brought about by the static population. Anybody with any get up and go, went, and the was no incentive for any new people to come into the village with the consequence that, according to Phipps, they had become very incestuous. There is no doubt that looking at a names on the census returns we see the same surname time and time again.
This situation changed dramatically from 1901. The population doubled in the 30 years to 1931 and then doubled again to 1961.
The railway eventually reached Chalfont St Giles in 1889 with a station in the far north of the parish and situated on the road from Amersham to Rickmansworth in what is now Little Chalfont.
Not that long after the car arrived and the combination of road and rail meant that Chalfont St Giles was no longer such an isolated community. The impact on the population was dramatic primarily through the development of new housing.
------------------------------------------ May 2015
REFERENCES. Unless otherwise specified, all references given above refer to catalogue references at the Centre for Buckinghamshire Studies at Aylesbury. (County Record Office)
This print is a section of the Chalfont History website.
Please come back soon.
John Dodd ©2015 www.chalfonthistory.co.uk
